Using historic and modern mapping to identify Attributes of Outstanding Universal Value
Once you have familiarised yourself with the seven Attribute types within the WHS, check the online mapping to see it there are any Attributes within, or around, your development site:
Cornwall and the Isles of Scilly's Historic Environment Interactive Mapping
The mapping available here usefully extends into west Devon to cover the Tamar Valley and Tavistock Area of the WHS, but if you are in Devon and using a post code to search by, please use the Devon link below:
Devon County Council Environment Viewer
Using the Cornwall Council online mapping:
Use the ‘Search’ icon located in the top left-hand corner of the map web page to enter your location postcode, or part of your address, to centre the map on your property.
Please note: the ‘+’ and ‘-‘ (plus and minus) buttons can be used to change the view scale of the map and to reveal greater detail as the view is zoomed in. If using a computer or laptop, the mouse wheel button enables the user to zoom in and out quickly.
Firstly, please click on the ‘Layers’ icon, click then select the ‘World Heritage Site Areas’ option (found under ‘Designations’ and also ‘Mining’). You should now be able to zoom in and move around the view to determine if your property is within an Area of the WHS. If it is, please click on the shape and a pop-up window will tell you within which of the 10 Areas you are located. This link also provides a short description about that Area on the WHS home page.
If you are not within the WHS your project may not be affected by the WHS, but it is recommended you zoom the map out to establish how far you are away from a WHS Area and whether your site or project might be affected by it being within the ‘setting’ of the WHS (for more information on setting, please see the section What is the WHS Setting?).
If your project is within a WHS Area or potentially just outside the boundary of an Area (i.e. within its setting), then you will need to establish if your development is affected by any WHS Attributes, or other historic features, within or near your project’s location.
Historic maps allow you to compare the development site today with how it looked in the latter years of the nineteenth century and the early twentieth century (around the 1880s and 1907, respectively). These historic Ordnance Survey maps can be accessed by selecting the ‘Basemap’ icon and clicking on the relevant map layer. Please note by using the ‘Transparency’ slider it is possible to view the modern map underneath. In addition, you can access further information by switching on other layers such as ‘Listed Buildings’ and, as with the WHS layer, there are links to other detailed information.
The ‘Event record’ layer is very useful as it provides links to published reports, such as the Cornwall Industrial Settlements Initiative (CISI) surveys and the Cornwall and Isles of Scilly Urban Survey (CSUS) studies produced in the 2000s (these reports can also be found on the Cornwall Council Appraisals and Surveys webpage, while Cornwall's Heritage Hub gives access to Historic Environment Record (HER) guidance as well as projects such as that addressing Cornish distinctiveness).
While the modern digital colour mapping appears noticeably different from the historic black and white paper sheets of yesteryear, the online interactive mapping enables the different maps to be seamlessly overlain, zoomed, and the various data layers turned on and off as the viewer wishes.
Using the Devon County Council online Environment Viewer:
After reading and accepting the Devon County Council web disclaimer, use either the mouse pointer or touch the screen to move the map view around and the slide bar (located top left) to zoom the map view in and out.
The viewer’s ‘Address Search’ option (top left) allows you to search for properties by post code. The Viewer’s ‘Map Options’ tab (top right) enables the display of historic mapping with the Ordnance Survey First and Second Edition maps of c.1880 and c.1907 being particularly useful in identifying WHS Attributes. The ‘Map Options’ tab also gives access to modern and historic aerial photographs.
A number of map data layers are available for viewing and these can be selected using the list to the left of your screen under the ‘Historic Environment’ tab. Tick the ‘World Heritage Sites’ box within this list to show the Tamar Valley with Tavistock Area of the World Heritage Site (Area A10). Features such as Listed buildings and Scheduled Monuments can also be displayed by selecting options under the ‘Historic Environment’ tab.
How to identify Attributes of Outstanding Universal Value using historic maps online
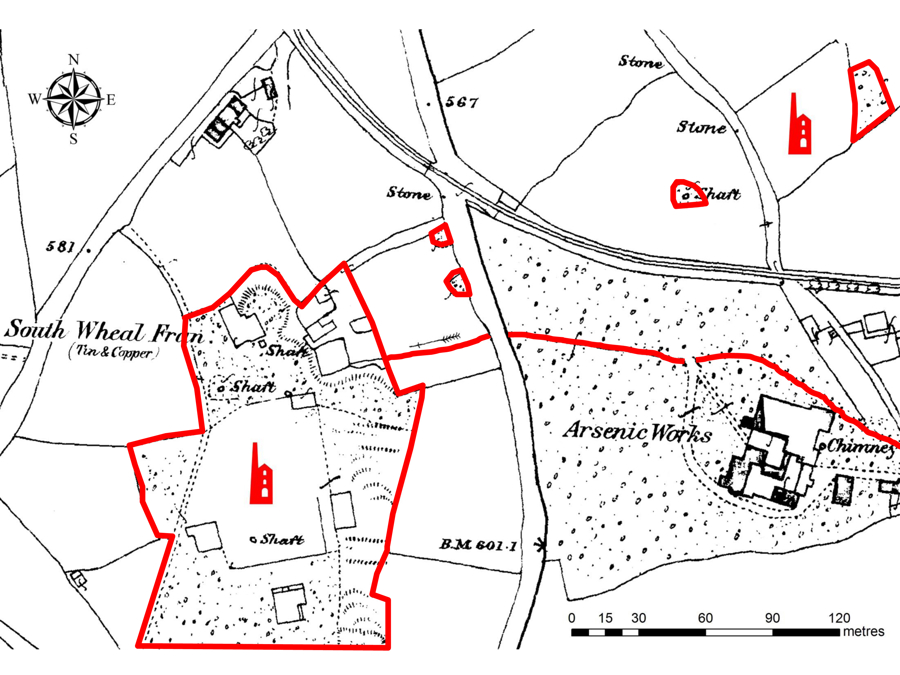
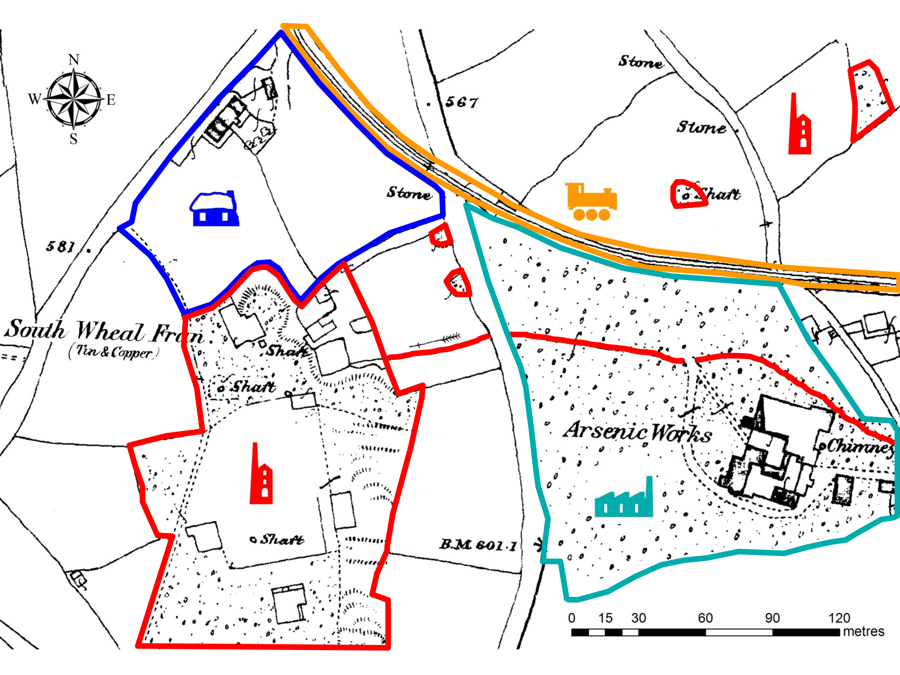
To interpret historic maps, it is useful to see examples of how Attributes are shown within these. The following images have been created to show two sections of a hypothetical Ordnance Survey map dating from around the 1880s. These show some of the Attributes that are typical at many locations within the WHS. There are five of the seven landscape Attribute types included within these map images, these being: a mine site, an ancillary industry (an arsenic works), a series of mineworkers’ smallholding fields and a cottage, a mineral railway and, lastly, an imaginary mining village – ‘Bal Moor’.
In each view the various Attributes are colour coded for convenience and where directly related Attributes are mentioned, such as the mine’s gunpowder magazine (store), these are colour coded to match.
Within our first hypothetical WHS landscape we have a mine site, which is in this instance named ‘South Wheal Fran’. This is indicated as producing both tin and copper and the site includes features common to many mines of the nineteenth century, including a Cornish type steam pumping engine, and its adjoining boiler house, alongside the mine’s pumping engine shaft. A leat, a man-made watercourse, is also shown, as this is required by the mine to deliver water to the engine’s boilers. The last also powers the operation of the adjoining Arsenic Works (below), by means of a water wheel. All the mine features are set within an area of mine waste spoil (mine dumps) which are shown on the map as pock-marked irregular rock-strewn ground in and around the buildings and shafts.

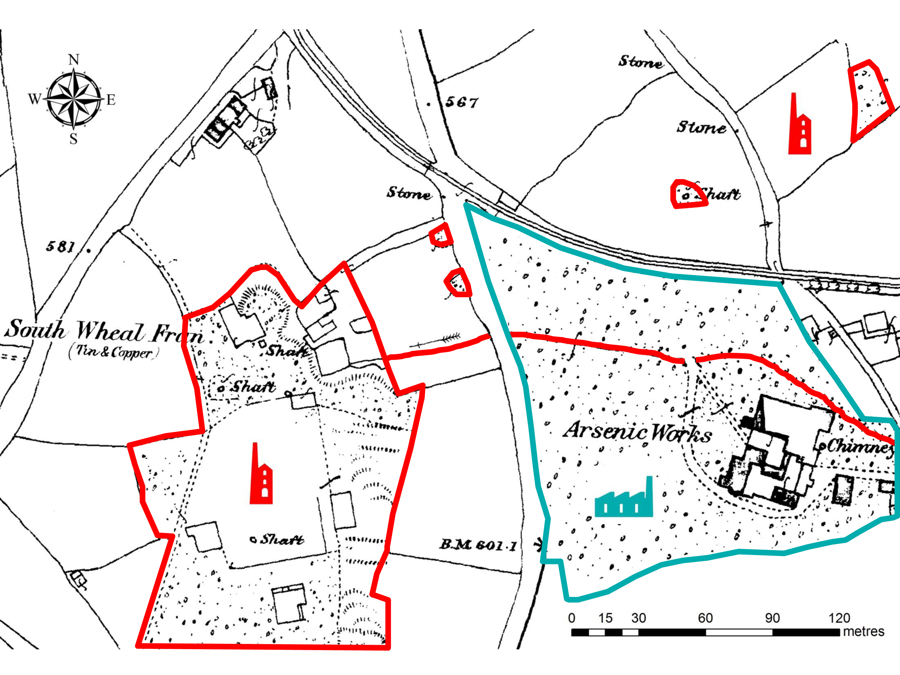
Away from the mine itself, and to the east (right), we have an ancillary industry - in this example an Arsenic Works which produced raw or refined arsenic for sale for use in products such as insecticides, dyes, paints and medicines. An arsenic works is one of many examples of a mining ancillary industry, others include engineering foundries and gunpowder manufacturing sites. The Arsenic Works machinery is powered by a water wheel fed by a leat, a man-made watercourse, and this can be seen flowing from east to west across the site.

Around the mine and between it and the Arsenic Works are several very small fields which form part of adjoining mineworkers’ smallholdings. These were small subsistence farms, i.e. farms raising crops and animals solely for consumption of the individual family concerned. These are a common though little recognised feature within mining landscapes across Cornwall. While a great many smallholdings have lost hedge boundaries to changing farming practices during the twentieth century, many survive to illustrate how the broader landscape was reshaped through the dominating influence of metal mining. The imaginary map here also shows individual mine shafts, or indications of shafts shown as small areas of rough ground, seemingly remote from the cluster of buildings at the focus of the workings. This spread of features is common, however, as the various shafts can be connected by perhaps hundreds of metres of individual levels (tunnels) underground, along the strike (direction) of a mineral lode (ore body).
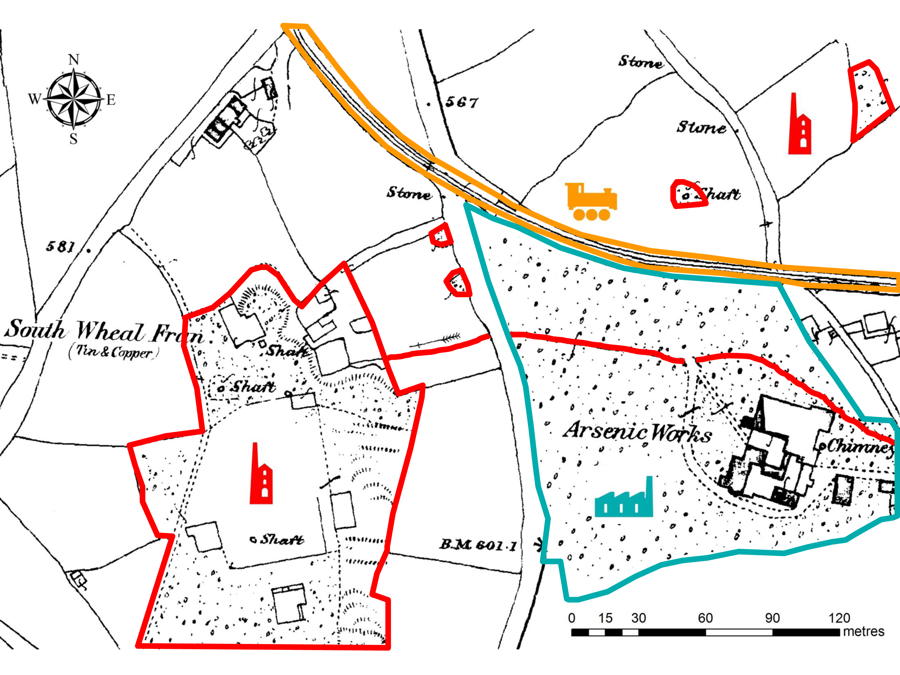
At the top of the map we have an example of mine transport infrastructure in the form of the route of a mineral railway used to transport metal ores and materials between the mines and mineral harbours. Rather like mineworkers’ smallholdings, the routes of former mineral railways can sometimes be difficult to spot in the landscape, being, in this case, most likely enclosed within parallel tall Cornish hedges. While easily overlooked, such routes were an essential part of the mining industry and enabled the transportation of many thousands of tons of cargo while in operation.

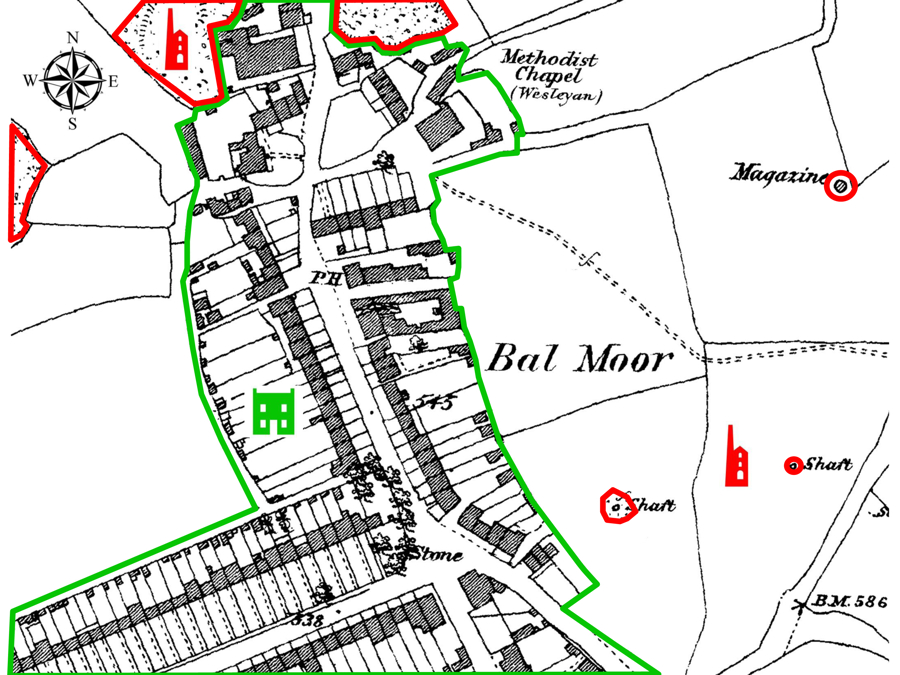
Our second map section view is dominated by a mining settlement, in this case the imaginary village ‘Bal Moor’, and here we see the linear rows of mineworkers’ cottages with their characteristically long front or rear gardens, used to grow the family’s staple fruit and vegetables. Numerous privies (outside toilets) and other outbuildings can be seen at the rear of the garden plots, which were essential features of the individual dwellings. Alongside these within the village is a non-conformist Methodist Chapel, in this case of the Wesleyan denomination. This is an example of the social infrastructure common throughout the mining districts. Although not indicated within the map, Bal Moor would also have had numerous small shops and other businesses serving the community.
The first hypothetical map view shows a mine site (‘South Wheal Fran’) alongside several other features which are the sites of mine shafts positioned along the strike (direction) of the mineral lode (ore body).
The second hypothetical map view also highlights a mining ancillary industry, in this instance an Arsenic Works. This refined raw arsenic ‘soot’ to produce a pure white product suitable for sale.
The third hypothetical map view in the sequence highlights a mineral railway which falls under the category of mine transport infrastructure . Mineral railways were used to transport mineral ores and supplies between the various mines and mineral harbours.
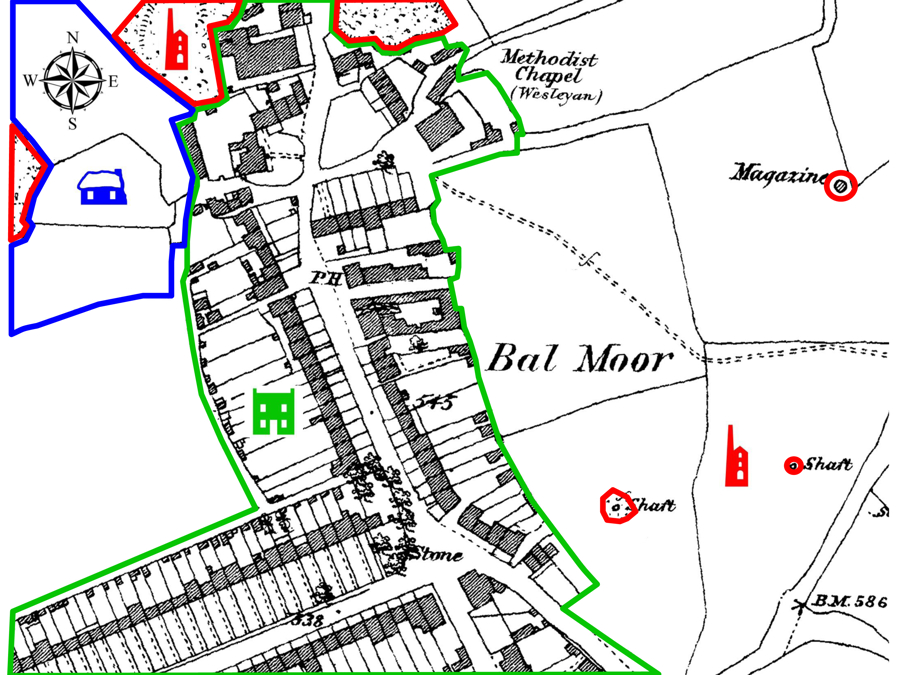
The final hypothetical map view in the sequence highlights a mineworkers’ smallholding. Consisting of two small fields and a cottage, this is characteristic of the small subsistence farms which were established in great numbers in the eighteenth and early nineteenth centuries in response to the need for productive land to support the growing mining populations.
The first hypothetical map view in the second sequence shows several mine site features adjacent to the mining village ‘Bal Moor’. Five mine shaft sites are shown in addition to a mine gunpowder magazine (store) which was used to secure the explosive safely away from the public.
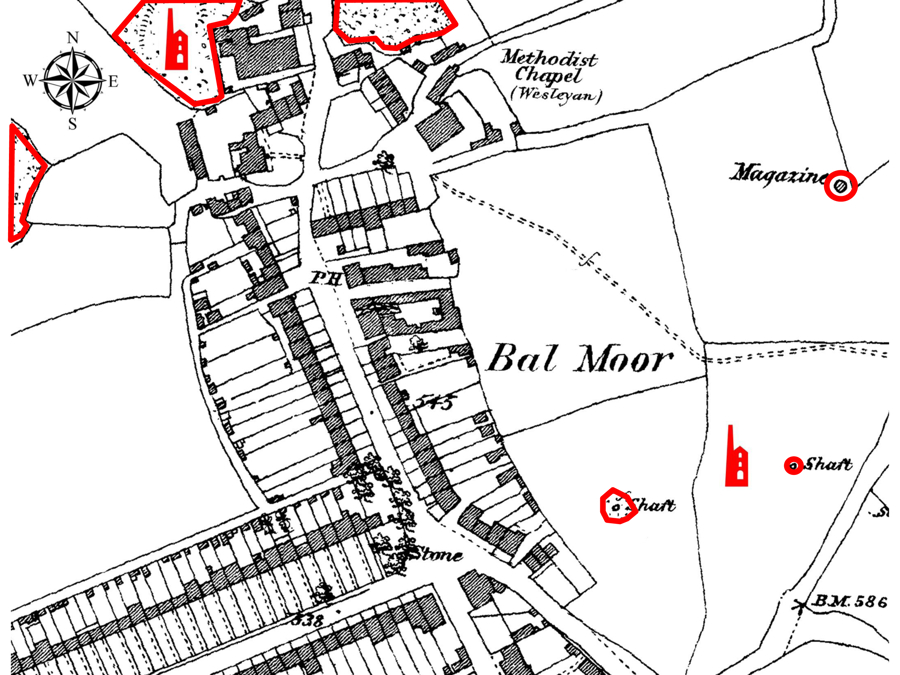
The second view highlights the imaginary mining settlement, or village, ‘Bal Moor’. Consisting of tight rows of modest terraced cottages with extensive linear garden plots and outside privies (toilets), villages like Bal Moor were established in many mining districts across Cornwall and west Devon.
This final view highlights another mineworkers’ smallholding directly adjoining the limits of the village.
The above hypothetical map views have been created to show multiple Attributes together for illustrative purposes and it should be noted that in many real-world situations there may be only one or two Attributes present at, or near, any given location. Hopefully these and the above descriptions serve as a useful introduction to enable you to decide if you require an HIA to accompany your project planning application.
To decide if to approve your project, the local planning authority needs the application or your HIA to identify all Attributes present, in accordance with the requirements of the National Planning Policy Framework (NPPF) and the National Planning Policy Guidance (NPPG), and to set out how your proposals either avoid causing harm or better reveal their historic significance.